Knowledge Hub
Menu
All items
Articles
News
Events
Article
10 October 2024
The power of Kubernetes in the S3 Passenger SaaS solution
News
26 March 2025
S3 Passenger now powers NOR-WAY Bussekspress
Article
4 March 2025
A new way to reach your destination with Navigator 2.0
News
12 December 2024
NMBS/SNCB rolls out non-reserved ticketing with S3 Passenger
News
20 September 2024
DSB selects Sqills' S3 Passenger for future-ready operations
News
12 September 2024
Sqills to power multi-operator bus network organisation NOR-WAY
Article
5 July 2024
Open access and reserved - two public transport options getting closer
News
29 May 2024
OSDM standard makes iryo tickets available through Trenitalia channels
News
21 May 2024
S3 Passenger from Sqills now powers Swedish rail operator SJ
News
8 May 2024
Go live with benerail realised after 10-month implementation period
News
1 February 2024
Sqills and benerail join forces to further implement OSDM
Article
12 January 2024
OSDM and Sqills - what it means now and going forward
Article
11 December 2023
The Power of Dynamic Pricing with S3 Passenger - an introduction
News
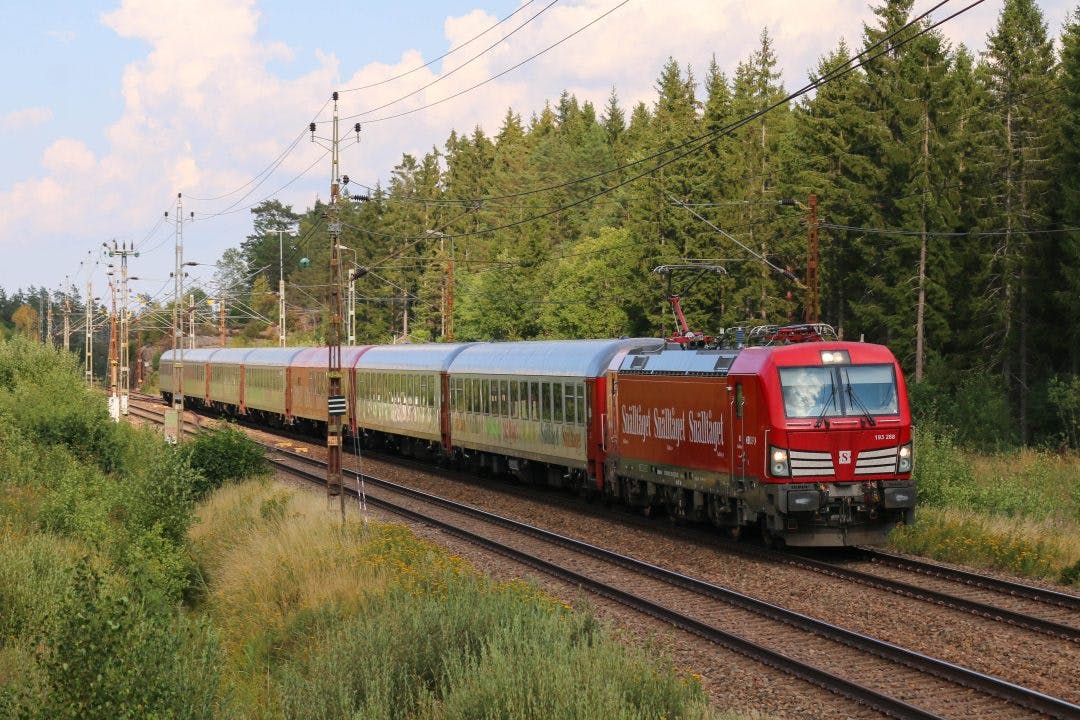
12 June 2023
Snälltåget selects S3 Passenger to power its business
News
13 April 2023
Brightline to implement state-of-the-art inventory and reservation system
Events
8 March 2023
Sqills to attend the Smart City Summit & Expo in Taiwan
Article
16 February 2023
Sqills to provide OSDM Validator tool to the international rail IT community to enhance standardisation
News
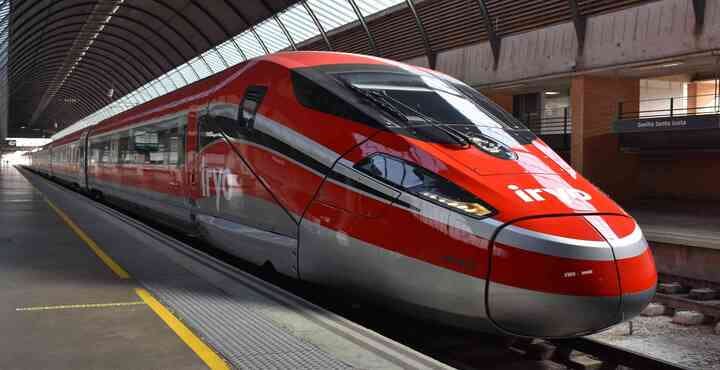
27 September 2022
High-speed operator iryo implements S3 Passenger in only 12 months
Events
24 September 2022
Sqills at InnoTrans 2022 in Berlin
News
5 August 2021
Sqills to join Siemens Mobility
News
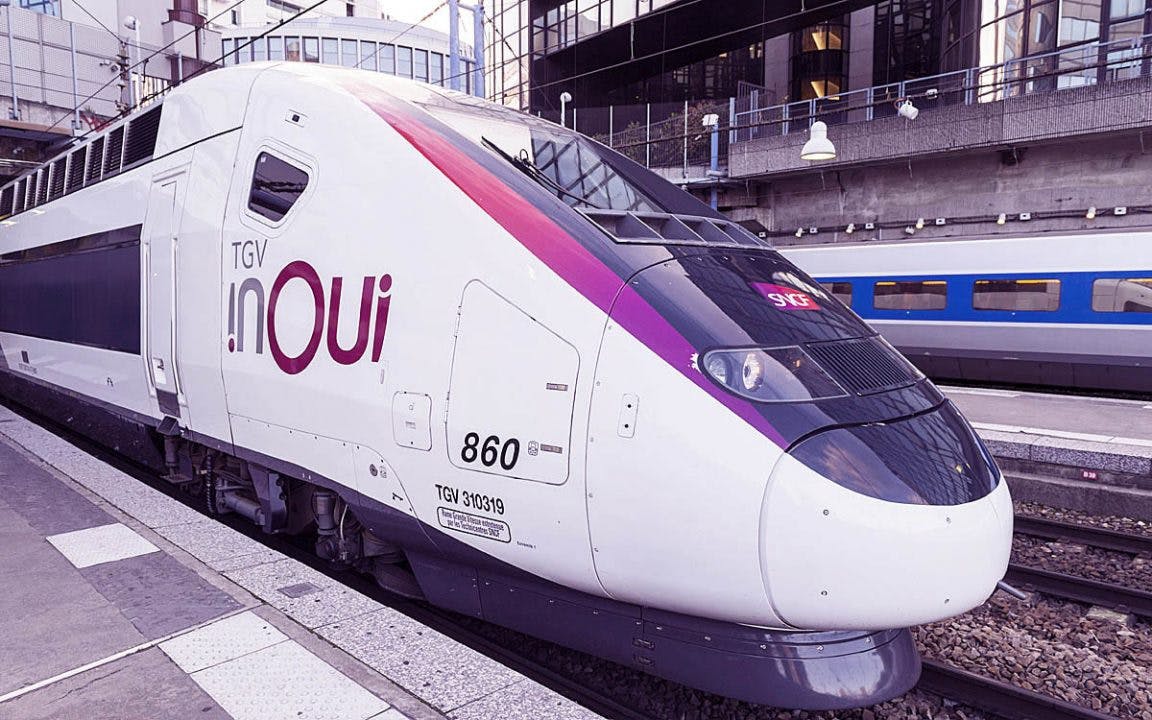
18 May 2021
SNCF selects S3 Passenger as their new reservation system
News
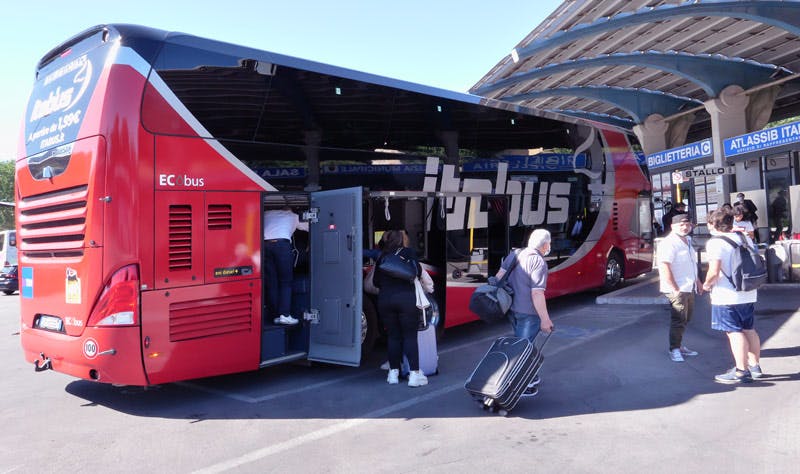
11 May 2021
Sqills now powers Italian Bus Startup Itabus
News
21 April 2021
Swedish rail operator SJ to strengthen its digital capabilities by partnering with S3 Passenger
Article
13 April 2021
Commercial Seat Selection Features in S3 Passenger
Article
8 April 2021
S3 Passenger first inventory management system to implement OSDM standard
News
24 March 2021
Irish Rail S3 Passenger environment now migrated to AWS Cloud
News
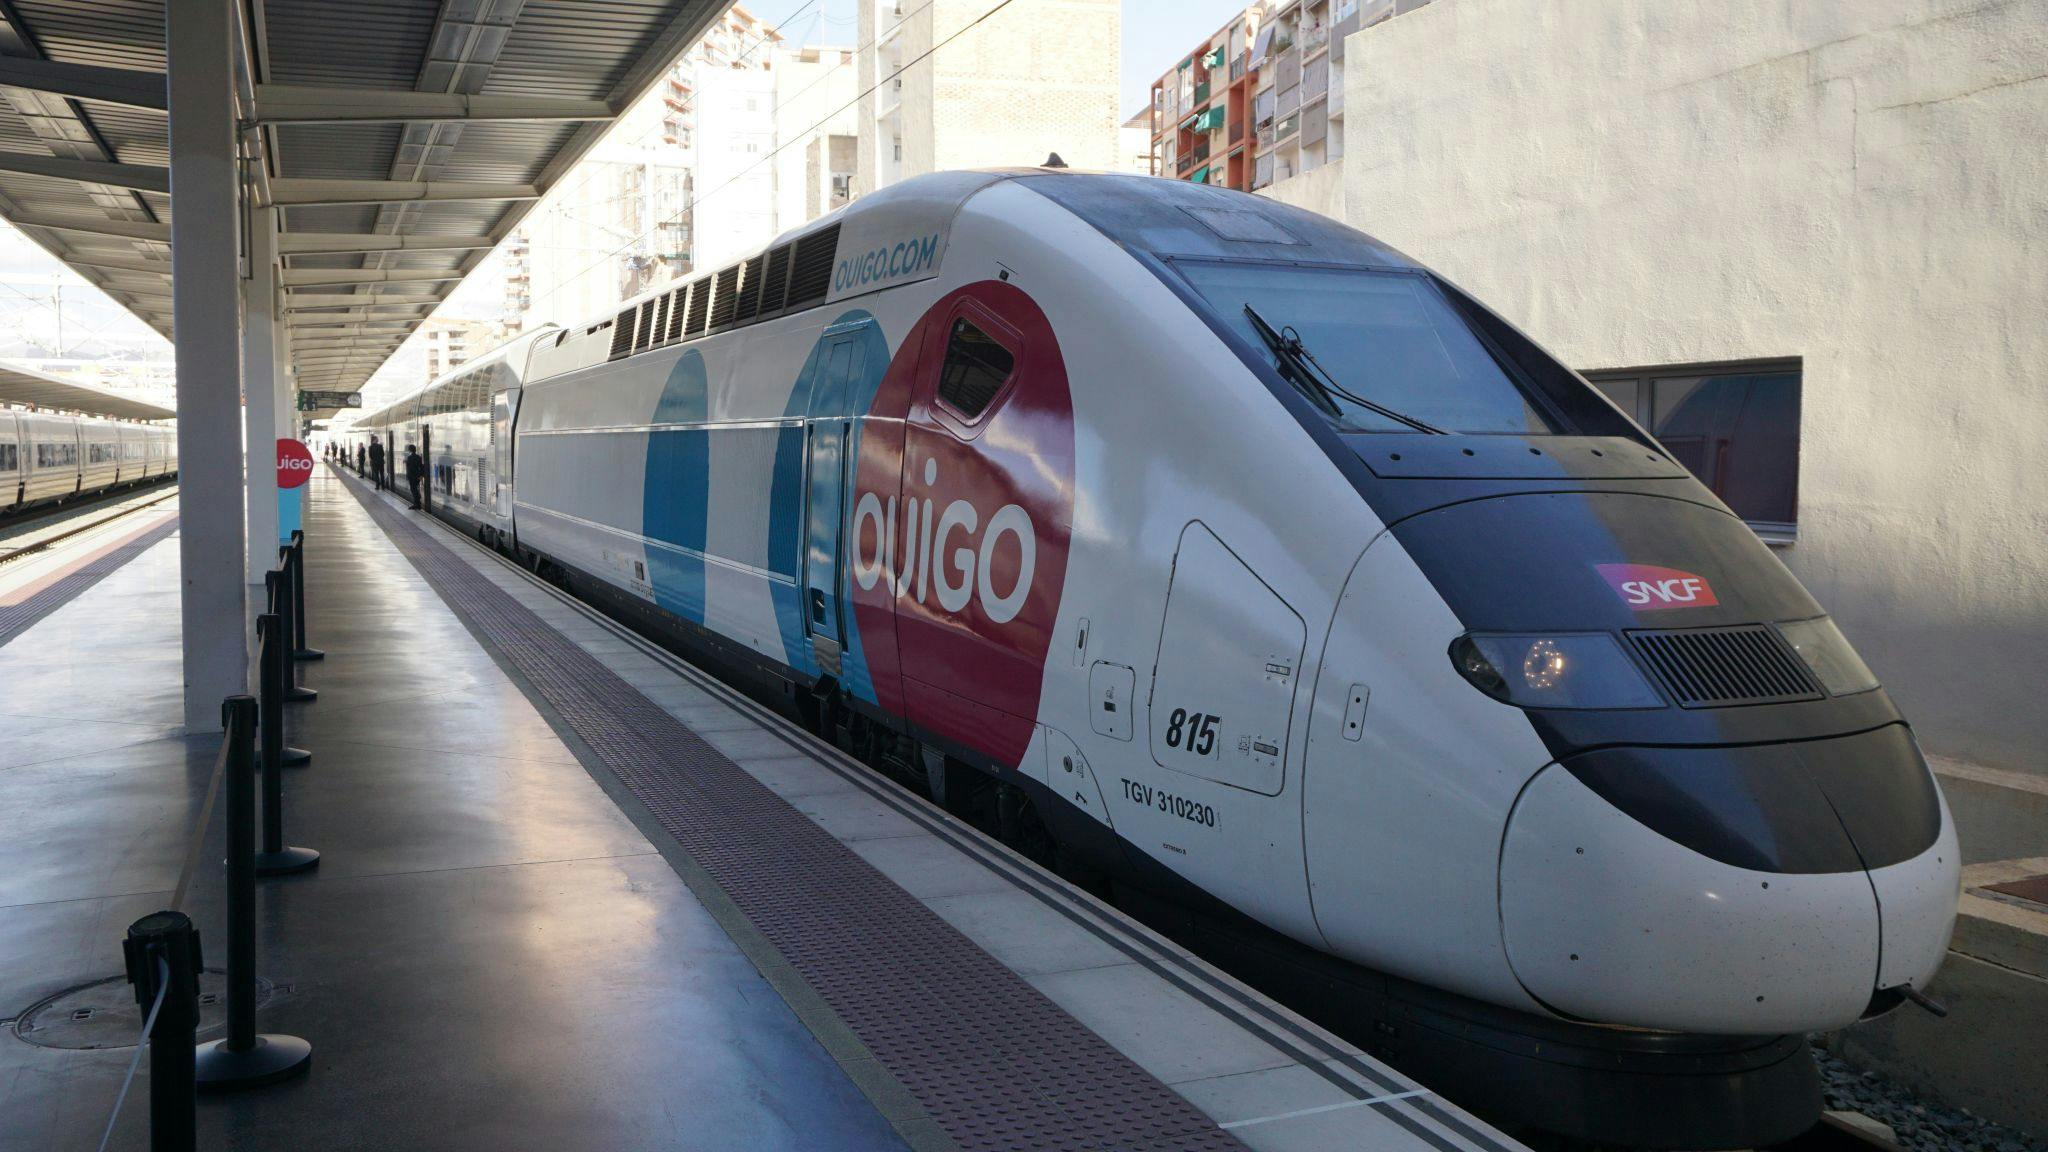
10 December 2020
Sqills expands its European coverage with S3 Passenger for OUIGO Spain
News
3 November 2020
Iarnród Éireann Irish Rail extends S3 Passenger contract into SaaS mode
News
21 October 2020
Sqills enters North America with S3 Passenger for VIA Rail
News
13 October 2020
First British carriers now live on S3 Passenger
News
23 March 2020
Eurostar now live on S3 Passenger
News
5 December 2019
Sqills is now PCI-DSS level 1 certified
News
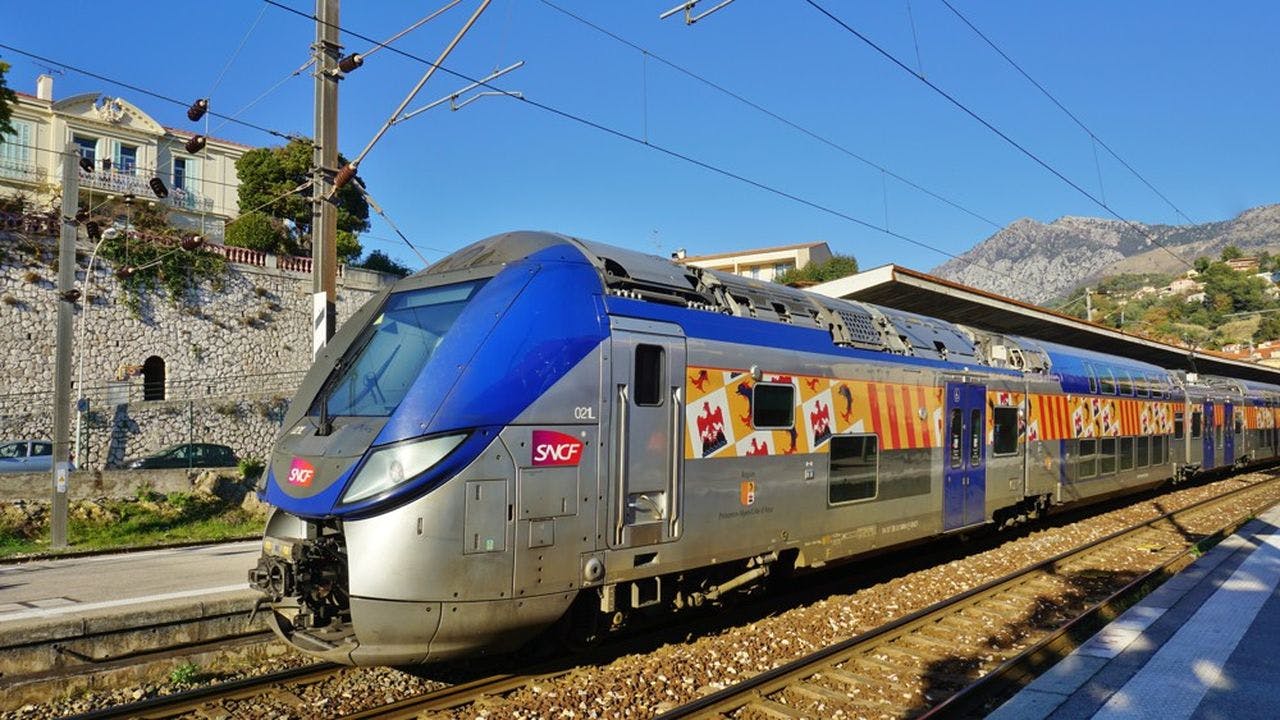
26 June 2019
New partnership with TER: Sqills gains more foothold in France
News
31 May 2019
Sqills working with the RDG to transform rail travel for passengers across the UK network